Figures
Phosphocreatine + MgADP- + H+ ? MgATP2- + Creatine
Figure 1: The reaction catalyzed by CK that drives the phosphocreatine circuit (3).
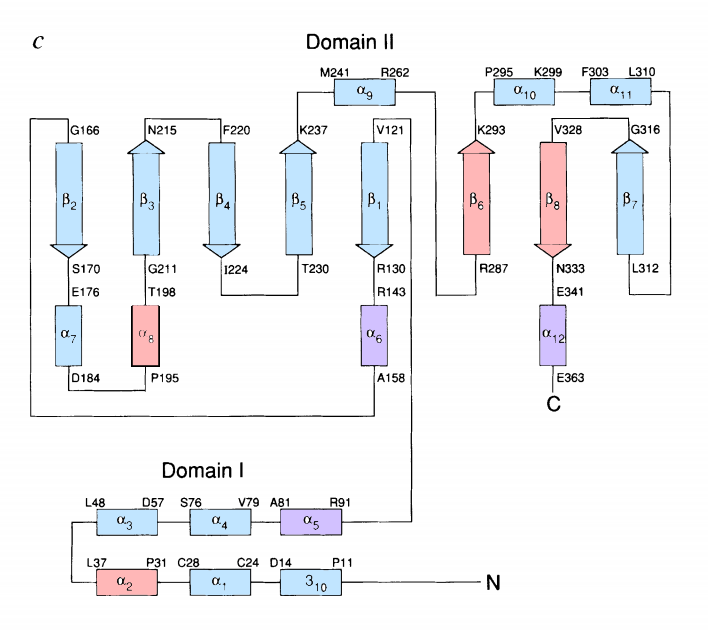
Figure 2: Schematic drawing of sMtCK secondary structure, where pink represents hydrophobic regions, blue represents hydrophilic regions, and purple represents a combination (not necessarily amphipathic, as determined by a helical wheel). Image from (2); determination of hydrophobicity based on (16).
Figure 3: Comparison of protein kinases containing consensus P-loop sequences (2,6).
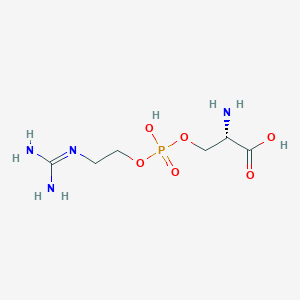
Figure 4: Structure of creatine (left) and lombricine (right) (17,18).